
The Speed of Trust. The One Thing that Changes Everything
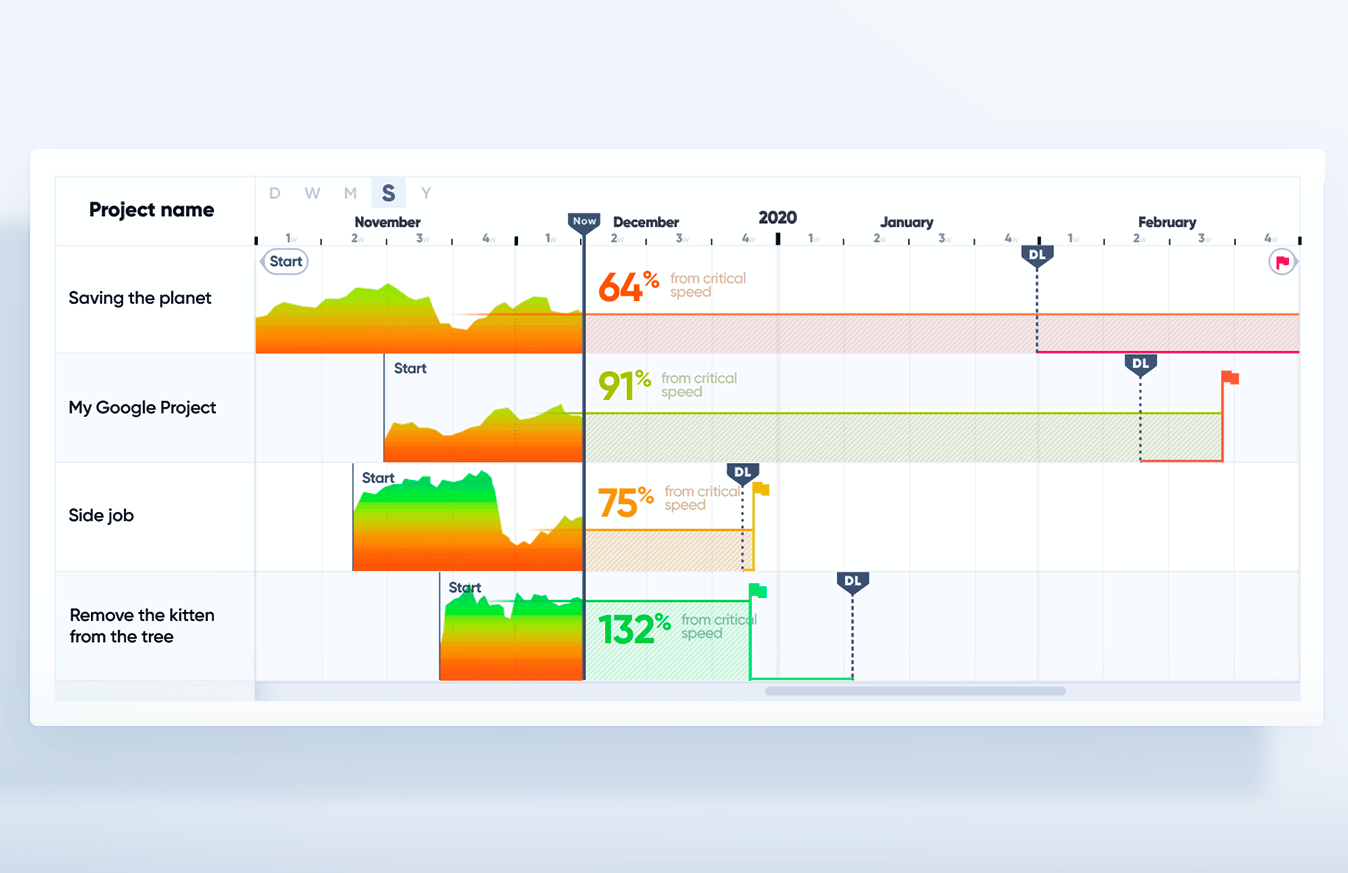
Team progress graph in your project
These graphs show the speed of work on the project of the whole team, or the executor individually, over the past time.
The speed is relative and shows the real progress of the team over time, relatively fast enough to hit the deadlines.
The speed is relative and shows the real progress of the team over time, relatively fast enough to hit the deadlines.
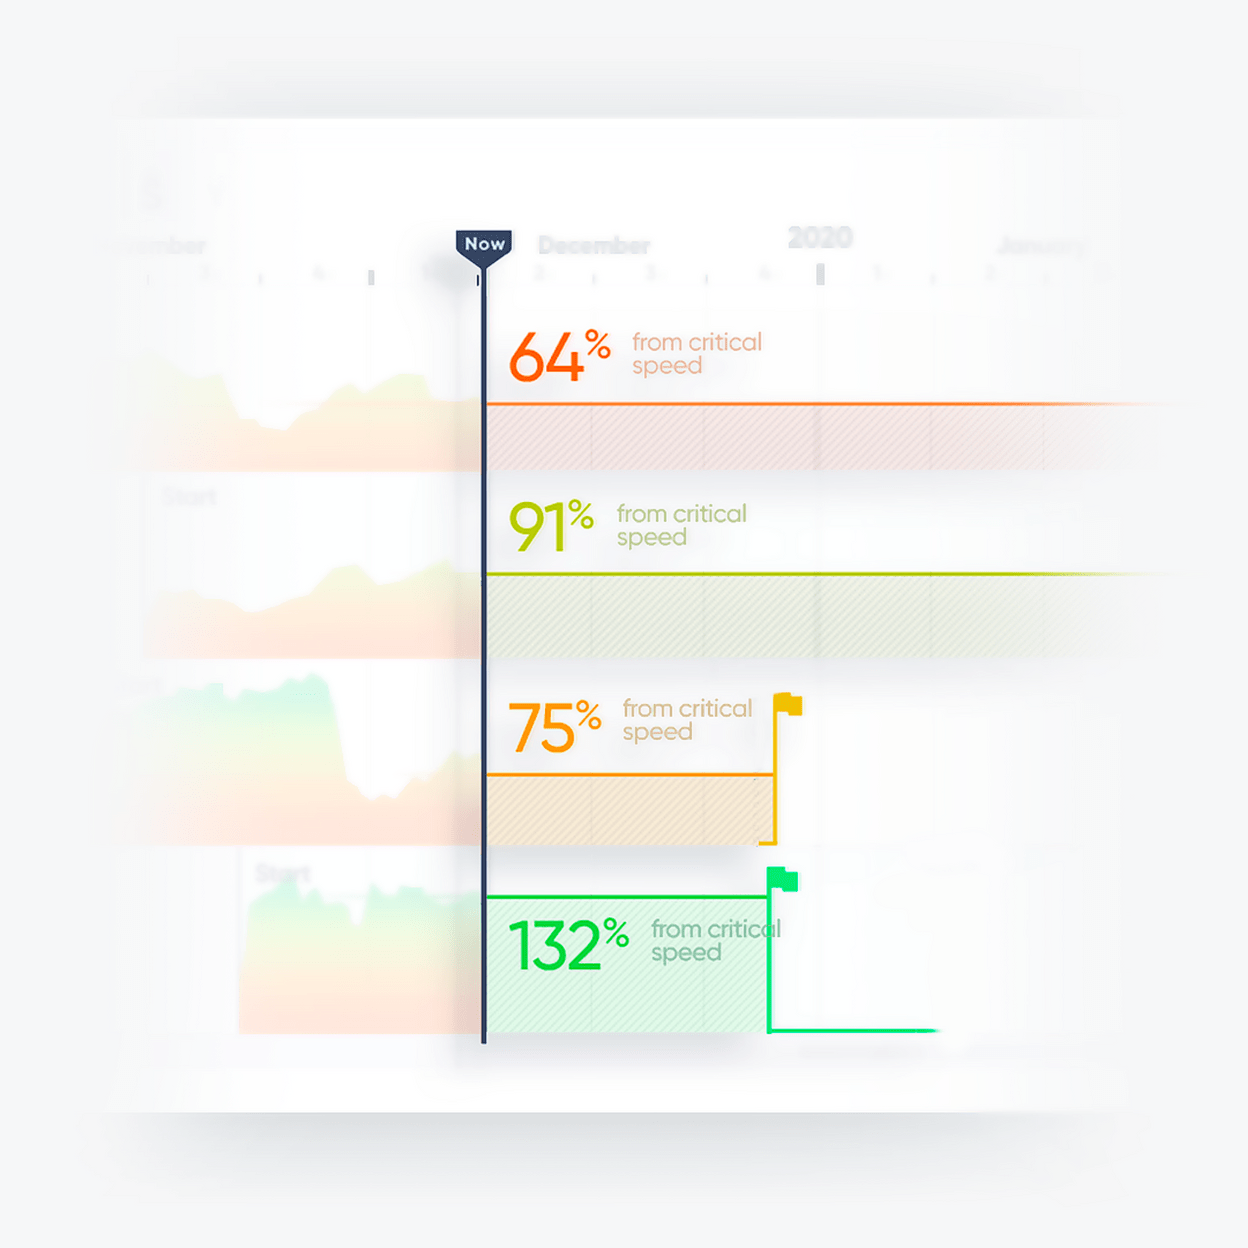
The real rate of progress of your project
Now (line)
This line distinguishes between past and future project progress, and shows the current point.
From critical speed
This designation of relativity to the speed of which would be sufficient for the success of reaching the deadline
Switch progress of project one developer or all team
You can switch the indication of progress over the project regarding each developer or regarding all your projects
Deadline forecast at your current speed
We use an algorithm that predicts your current deadline.
For this, various project indicators are taken into account: the current speed of execution of the entire team and each participant individually (its characteristics), the dynamics of trends over similar projects.
For this, various project indicators are taken into account: the current speed of execution of the entire team and each participant individually (its characteristics), the dynamics of trends over similar projects.
Other features
Timing failure risks forecast
Timeline panel
Timeline update by chat-bot
Control performanceof their projects along with ProjectAssist
Control performanceof their projects along with ProjectAssist

+7 (989) 528-32-68
At any time
Rostov-on-Don, Russia
At any time
Rostov-on-Don, Russia